Freedom251 › Data Visualization Software
ggoncoplot
What ggoncoplot is
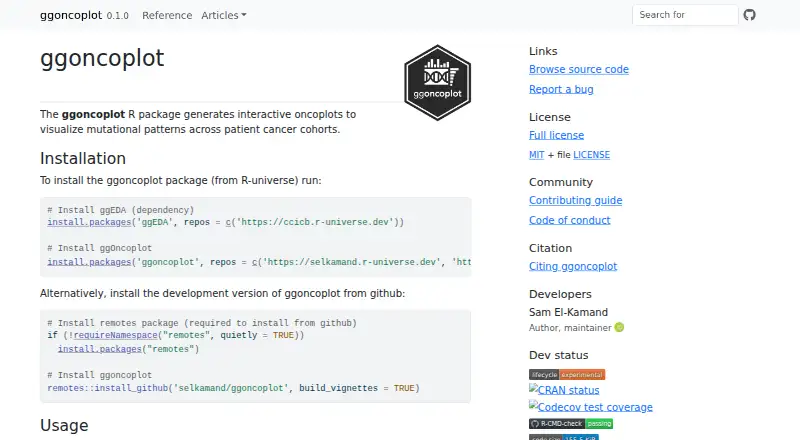
ggoncoplot is a free, open-source R package for building interactive oncoplots that display mutation patterns across cancer patient cohorts. It accepts a data frame, data.table, or tibble containing one row per cohort mutation, with gene symbol and sample identifier columns; mutation type and tooltip fields are optional. Interactive plots can provide tooltips, link data, select matching records across plots, and copy values when a tile is clicked. Visualizations may include gene-frequency and tumor-mutation-burden barplots, as well as numeric or categorical sample metadata. The package can choose accessible palettes for mutation consequence labels aligned with PAVE, Sequence Ontology, or MAF classifications. Users can include or exclude genes, set sample order, customize palettes, and provide pathway data. The maker also describes applications to promoter or enhancer mutations and non-genomic entities such as microbiome data. Results are returned as ggplot objects or interactive girafe objects. It runs on Linux desktop and is installed from R-universe or GitHub.
Who it suits
It suits researchers working with cancer cohort mutation data who use R on Linux. It is also relevant for users visualizing noncoding features or non-genomic entities.
What it does well
- Free and open source
- Interactive tooltips and cross-selection
- Gene and mutation burden barplots
- Custom gene, order, and palette controls
- Supports pathway and metadata overlays
What to know first
- Linux desktop platform only
- Responsiveness can slow with larger tile counts
- No free trial because it is free software
Plans
| Plan | Billed and limits | Price |
|---|---|---|
| ggoncoplot R package | MIT-licensed software · install from R-universe or GitHub | Free |
As selkamand.github.io lists them, read 12 Oct 2026. The maker's own page has the final word.
Verdict
ggoncoplot focuses on interactive mutation visualization with flexible inputs, annotations, and palette controls. Larger sample-by-gene plots may respond more slowly, especially when tooltips contain substantial information.
Facts from ggoncoplot's own pages
- Audience
- The maker presents the package as a way to make oncoplots more accessible to researchers working with cancer cohort mutation data. · selkamand.github.io, 12 Oct 2026
- Coloring
- The package can automatically select accessible palettes for mutation consequence labels aligned with PAVE, Sequence Ontology, or MAF variant classifications. · selkamand.github.io, 12 Oct 2026
- Customization
- Users can select or exclude genes, set sample order, customize palettes, and provide pathway data. · selkamand.github.io, 12 Oct 2026
- Dashboard type
- static · selkamand.github.io, 24 Sept 2026
- Data scope
- The maker describes use for noncoding features such as promoter or enhancer mutations and non-genomic entities such as microbiome data. · selkamand.github.io, 12 Oct 2026
- Embedded dashboards
- No · selkamand.github.io, 24 Sept 2026
- Features
- Plots can include gene frequency and tumor mutation burden barplots, plus numeric or categorical sample metadata. · selkamand.github.io, 12 Oct 2026
- Input
- It accepts a data frame, data.table, or tibble with one row per cohort mutation and columns for gene symbol and sample identifier; mutation type and tooltip columns are optional. · selkamand.github.io, 12 Oct 2026
- Integrations
- The package is built on ggplot2 and uses ggiraph for interactive plots; the maker also acknowledges patchwork. · selkamand.github.io, 12 Oct 2026
- Interactivity
- Interactive mode supports tooltips, data linking, cross-selection across plots, and copying values when a plot tile is clicked. · selkamand.github.io, 12 Oct 2026
- License and security
- The package uses the MIT License, which disclaims warranties; the maker's pages opened provide no security certification or compliance claim. · selkamand.github.io, 12 Oct 2026
- Limitations
- Interactive responsiveness may slow as the samples-by-genes tile count grows, especially when tooltips contain substantial information. · selkamand.github.io, 12 Oct 2026
- Output
- The function returns a ggplot object or, in interactive mode, a girafe object. · selkamand.github.io, 12 Oct 2026
- Performance
- The maker reports rendering an interactive oncoplot for 1,026 TCGA breast cancer samples in 0.81 seconds on a MacBook Pro with an M3 Pro chip and 18 GB RAM. · selkamand.github.io, 12 Oct 2026
- Platform
- desktop · selkamand.github.io, 24 Sept 2026
- Purpose
- The R package creates interactive oncoplots to visualize mutation patterns across cancer patient cohorts. · selkamand.github.io, 12 Oct 2026
- Scheduled refresh
- No · selkamand.github.io, 24 Sept 2026
- Support
- The project links users to GitHub to report bugs and provides a community contribution guide. · selkamand.github.io, 12 Oct 2026
Where ggoncoplot stands on Freedom251
- Data Visualization Software#70 of 98