Freedom251 › Interactive Map Software
eurostat-map.js
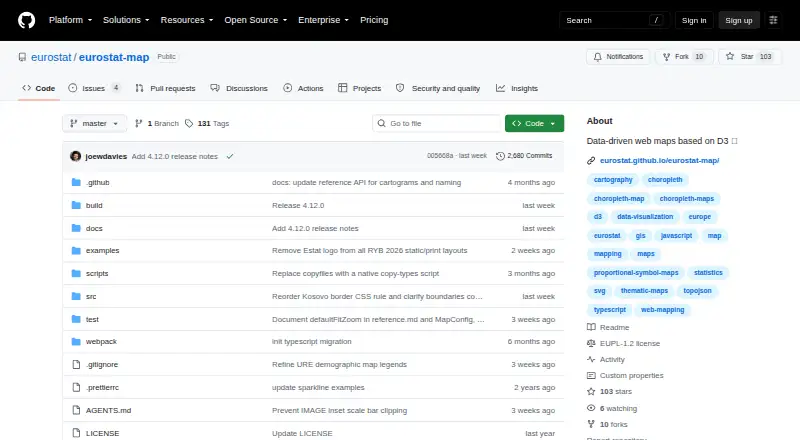
What eurostat-map.js is
eurostat-map.js is a free JavaScript library for creating interactive, publication-ready statistical maps about Europe. It renders maps as SVG through D3.js and documents choropleth, proportional symbol, pie chart, categorical, flow, bar chart, and cartogram formats. Data can come from the Eurostat database, CSV files, custom JavaScript objects, or JSON sources. Eurostat datasets use the JSON-stat standard. NUTS geographic shapes are loaded dynamically through the Nuts2json API in TopoJSON form, while custom geometries are also accepted. The project targets analysts, journalists, and institutions producing reproducible visualizations for exploration or official communication. Installation guidance covers npm and a script tag from unpkg. Documentation, examples, and a quickstart notebook are linked in the README, which also invites assistance requests. The project dates from 2018 and uses the EUPL 1.2 license. Eurostat NUTS data has stated copyright conditions.
Who it suits
It suits analysts, journalists, and institutions building reproducible European maps. Developers can use web or API environments and several supplied data sources.
What it does well
- Free plan available
- Several documented map types
- Supports Eurostat, CSV, JavaScript, and JSON data
- Custom geometries accepted
- Documentation and quickstart resources linked
What to know first
- Focused on Europe and NUTS data
- NUTS dataset use has copyright conditions
- Requires JavaScript development
Verdict
eurostat-map.js provides a focused toolkit for interactive European statistical mapping. Its data-source choices, map formats, and developer documentation support exploratory and official visualization work.
Facts from eurostat-map.js's own pages
- Data integrations
- The library supports retrieving statistics from the Eurostat database, CSV files, custom JavaScript data, and JSON data sources. · github.com, 5 Oct 2026
- Data use condition
- The README says the Eurostat NUTS dataset is copyrighted and subject to specific usage provisions and acceptance. · github.com, 5 Oct 2026
- Developer support
- The project README invites users to ask for assistance and links to its documentation, examples, and a quickstart notebook. · github.com, 5 Oct 2026
- Eurostat data format
- Eurostat dataset integration uses the JSON-stat standard. · github.com, 5 Oct 2026
- Geographic data
- NUTS geometries are fetched dynamically through the Nuts2json API in TopoJSON format, and custom geometries can also be supplied. · github.com, 5 Oct 2026
- Installation
- The README shows installation with npm and loading the library with a script tag from unpkg. · github.com, 5 Oct 2026
- Intended users
- The project says it is designed for analysts, journalists, and institutions creating reproducible map visualizations for exploratory analysis and official communication. · github.com, 5 Oct 2026
- License and project history
- The README lists the EUPL 1.2 license and says the project has existed since 2018. · github.com, 5 Oct 2026
- Map types
- Documented map types include choropleth, proportional symbol, pie chart, categorical, flow, bar chart, and cartogram maps. · github.com, 5 Oct 2026
- Purpose
- eurostat-map is a JavaScript library for building interactive, publication-ready statistical maps focused on Europe. · github.com, 5 Oct 2026
- Rendering
- It renders interactive maps as SVG using D3.js. · github.com, 5 Oct 2026
Where eurostat-map.js stands on Freedom251
- Interactive Map Software#18 of 40