Freedom251 › Data Visualization Software

D3.js
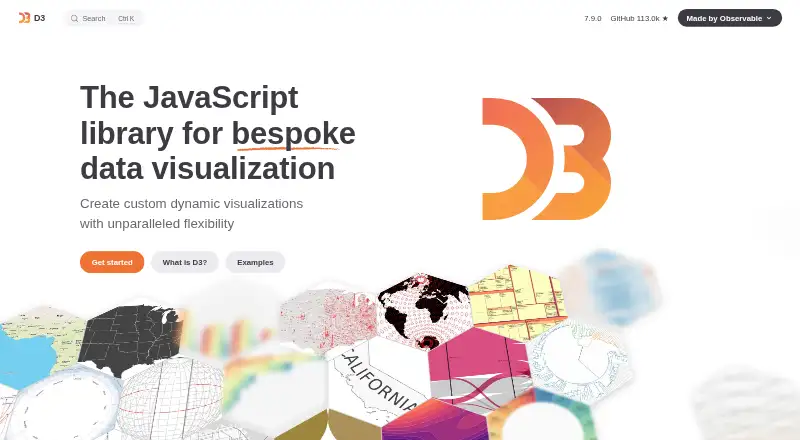
What D3.js is
D3.js is a free, open-source JavaScript library for creating dynamic visualizations from data. Its modules provide selections and transitions, scales and axes, shapes, interactions, layouts, geographic maps, data parsing, formatting, and statistics. The 30 discrete modules can be used independently or bundled together, and D3 works directly with web standards such as SVG and Canvas. It accepts CSV and JSON data and can be paired with React, Vue, and Svelte. Developers can load it from a CDN, install it through npm-compatible package managers, or download a local bundle for offline use; it works in any JavaScript environment. D3 has no built-in chart abstraction or default presentation, so users compose primitives and write the visualization themselves. Its data join separates enter, update, and exit operations, allowing elements to react to data changes and animate between states. The maker recommends it for bespoke visualizations requiring expressiveness and control, while noting that even a basic chart may take a few dozen lines of code and that it may be excessive for a private dashboard or one-off analysis. The DSV parser uses dynamic code generation and requires `unsafe-eval` in the Content Security Policy `script-src` directive. The community recommends GitHub Discussions for support.
Who it suits
D3.js suits developers building bespoke, data-driven visualizations who want to control how they are composed. It may be a poor fit for a quick one-off chart or private dashboard if writing visualization code is more work than needed.
What it does well
- Free and open source.
- 30 modules can be used independently.
- Works with SVG and Canvas.
- Supports CSV and JSON data.
- Can be downloaded for offline use.
What to know first
- Has no built-in chart abstraction or default presentation.
- A basic chart may require a few dozen code lines.
- DSV parsing requires `unsafe-eval` in the CSP directive.
Limits
D3 is free and open source, but it does not provide a chart abstraction or default presentation. The DSV parser requires unsafe-eval in the Content Security Policy script-src directive.
Plans
| Plan | Billed and limits | Price |
|---|---|---|
| D3 | Free, open-source JavaScript library · no chart abstraction or default presentation | Free |
As d3js.org lists them, read 11 Oct 2026. The maker's own page has the final word.
Getting started
- Open the D3.js website
- Load D3 from a CDN
- Install it with an npm-compatible package manager
- Download a local bundle for offline use
- Choose modules for selections, scales, shapes, layouts, or other needs
- Pair D3 with React, Vue, or Svelte if required
Verdict
D3.js provides flexible building blocks rather than ready-made chart designs, making it suited to custom visualizations.
Questions
How much does D3.js cost?
D3.js is free and open source, with a listed price of $0.
Which data formats does D3 support?
D3 supports CSV and JSON data sources.
Can D3 be used with frontend frameworks?
Yes. D3 can be paired with React, Vue, and Svelte.
How can D3 be installed?
It can be loaded from a CDN, installed through npm-compatible package managers, or downloaded as a local bundle for offline use.
Does D3 include ready-made charts?
No. D3 has no built-in chart abstraction or default presentation; developers compose its primitives and write the visualization.
Who maintains D3?
Observable develops D3, and Mike Bostock and Philippe Rivière maintain it.
Facts from D3.js's own pages
- Best fit
- The maker recommends D3 for bespoke visualizations that need maximal expressiveness and control. · d3js.org, 11 Oct 2026
- Data sources
- CSV,JSON · d3js.org, 20 Sept 2026
- Dynamic updates
- D3's data join supports separate enter, update, and exit operations so visual elements can respond to changing data and animate between states. · d3js.org, 11 Oct 2026
- Effort
- The maker notes that even a basic chart may require a few dozen lines of code and that D3 can be overkill for a private dashboard or one-off analysis. · d3js.org, 11 Oct 2026
- Frameworks
- D3 can be paired with React, Vue, and Svelte. · d3js.org, 11 Oct 2026
- Free plan
- Yes · d3js.org, 20 Sept 2026
- Maker
- D3 is developed by Observable, and Mike Bostock and Philippe Rivière maintain it. · d3js.org, 11 Oct 2026
- Modular design
- D3 is a suite of 30 discrete modules that can be used independently or bundled together. · d3js.org, 11 Oct 2026
- Not a charting library
- D3 has no built-in chart abstraction or default presentation, so users compose primitives and write the visualization themselves. · d3js.org, 11 Oct 2026
- Platform
- web · d3js.org, 20 Sept 2026
- Purpose
- D3 is a free, open-source JavaScript library for creating dynamic, data-driven visualizations. · d3js.org, 11 Oct 2026
- Runtime and downloads
- D3 works in any JavaScript environment and can be loaded from a CDN, installed through npm-compatible package managers, or downloaded as a local bundle for offline use. · d3js.org, 11 Oct 2026
- Security caveat
- The DSV parser requires `unsafe-eval` in the Content Security Policy `script-src` directive because it uses dynamic code generation for parsing. · d3js.org, 11 Oct 2026
- Support
- The D3 community page recommends GitHub Discussions as the preferred place for support requests and community engagement. · d3js.org, 11 Oct 2026
- Visualization tools
- Its modules cover selections and transitions, scales and axes, shapes, interactions, layouts, geographic maps, data parsing, formatting, and statistics. · d3js.org, 11 Oct 2026
- Web standards
- D3 works directly with web standards including SVG and Canvas. · d3js.org, 11 Oct 2026
Where D3.js stands on Freedom251
- Data Visualization Software#27 of 98
- Data Visualization Libraries Software#9 of 23