Freedom251 › Statistical Analysis Software
concstats
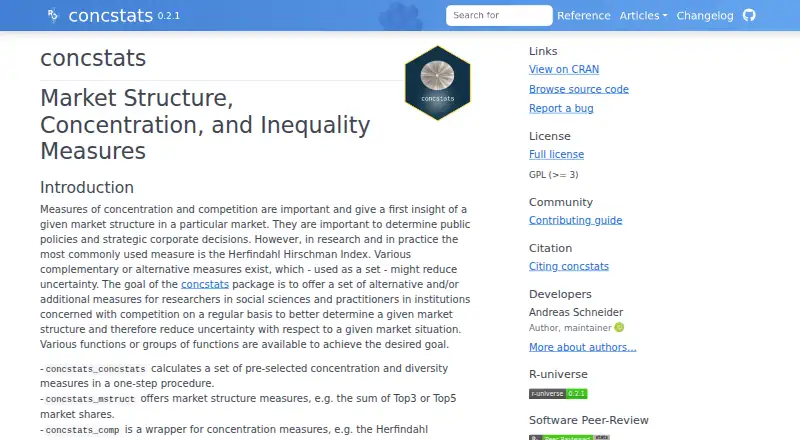
What concstats is
concstats is a free, open-source R package for examining market structure, concentration, inequality, and diversity. It is intended for researchers and practitioners working with competition data. Functions accept numeric vectors, including market shares written as decimals; integer inputs can be converted to decimal form. Measures cover firm counts, equivalent numbers, and cumulative Top 3 and Top 5 shares. Concentration calculations include the Herfindahl-Hirschman Index, its dual, the Dominance Index, and the Stenbacka Index. Inequality and diversity options include Entropy, the Gini coefficient, and the Palma ratio, with finite-sample correction available for most functions. A main function computes a selected batch of measures, while combined results can be returned in a table containing eight measures. concstats supports R scripting and is listed for API, Linux, macOS, and Windows use. It is distributed through CRAN, GitHub, and rOpenSci R-universe under GPL (≥ 3).
Who it suits
Researchers and practitioners analyzing competition, market shares, concentration, inequality, or diversity in R. It suits users who work with numeric vectors or data frames and want several measures together.
What it does well
- Free plan under GPL (≥ 3)
- Measures market structure and concentration
- Includes inequality and diversity metrics
- Batch function returns selected measures
- Available through CRAN, GitHub, and R-universe
What to know first
- Requires R scripting knowledge
- No free trial is listed
- CRAN dependency is R ≥ 2.10
Plans
| Plan | Billed and limits | Price |
|---|---|---|
| concstats R package | GPL (≥ 3) · R package | Free |
As docs.ropensci.org lists them, read 12 Oct 2026. The maker's own page has the final word.
Verdict
concstats brings market-structure, concentration, and inequality calculations into one R package. Its vector inputs and batch output are useful when you need several established measures together.
Facts from concstats's own pages
- Batch measures
- Its main function calculates a pre-selected set of measures in one step. · docs.ropensci.org, 12 Oct 2026
- Compatibility
- The CRAN package listing says it depends on R (≥ 2.10) and needs no compilation. · cran.r-project.org, 12 Oct 2026
- Compilation
- CRAN lists the package as not requiring compilation. · cran.r-project.org, 12 Oct 2026
- Concentration measures
- Its concentration functions include the Herfindahl-Hirschman Index, its dual, the Dominance Index, and the Stenbacka Index. · docs.ropensci.org, 12 Oct 2026
- Data import formats
- R numeric vectors and data frames · docs.ropensci.org, 23 Sept 2026
- Deployment
- desktop · docs.ropensci.org, 23 Sept 2026
- Distribution
- The package is available from CRAN, GitHub, and rOpenSci R-universe. · docs.ropensci.org, 12 Oct 2026
- Free plan
- Yes · docs.ropensci.org, 23 Sept 2026
- Inequality and diversity
- Inequality and diversity measures include Entropy, the Gini coefficient, and the Palma ratio; most functions offer a finite sample correction. · docs.ropensci.org, 12 Oct 2026
- Inequality measures
- Its inequality and diversity measures include Entropy, the Gini coefficient, and the Palma ratio, and most functions offer a finite sample correction. · docs.ropensci.org, 12 Oct 2026
- Input and output
- Functions accept numeric vectors, including market shares in decimal format or integers that are converted to decimal form, and selected measures can be returned together in a table. · docs.ropensci.org, 12 Oct 2026
- Input data
- Functions generally accept numeric vectors, ideally relative market shares in decimal format, and can convert integer inputs to decimal form. · docs.ropensci.org, 12 Oct 2026
- Install options
- The package is installable from CRAN, GitHub, or rOpenSci R-universe. · docs.ropensci.org, 12 Oct 2026
- Integrations
- The package page lists suggested R packages including rmarkdown, knitr, dplyr, devtools, kableExtra, and ggplot2. · cran.r-project.org, 12 Oct 2026
- License
- The package is released under GPL (≥ 3). · docs.ropensci.org, 12 Oct 2026
- Maintainer
- Andreas Schneider is listed as the author and maintainer. · docs.ropensci.org, 12 Oct 2026
- Market structure
- Its market structure measures include firm counts, equivalent numbers, and cumulative Top 3 and Top 5 market shares. · docs.ropensci.org, 12 Oct 2026
- Output
- The combined function returns eight selected measures, including firm counts, top market shares, HHI, normalized Shannon Entropy, and Palma ratio. · docs.ropensci.org, 12 Oct 2026
- Platforms
- CRAN lists Windows and macOS binaries and a source package; the package depends on R version 2.10 or later. · cran.r-project.org, 12 Oct 2026
- Purpose
- concstats is an R package that provides market structure, concentration, and inequality measures for researchers and practitioners concerned with competition. · docs.ropensci.org, 12 Oct 2026
- Review
- The rOpenSci package listing links to Software Review #559. · ropensci.r-universe.dev, 12 Oct 2026
- Scripting support
- Yes · docs.ropensci.org, 23 Sept 2026
- Support
- The project invites users to open an issue or pull request for questions or bugs. · docs.ropensci.org, 12 Oct 2026
Where concstats stands on Freedom251
- Statistical Analysis Software#33 of 106