Freedom251 › Data Visualization Software
Chemiscope
What Chemiscope is
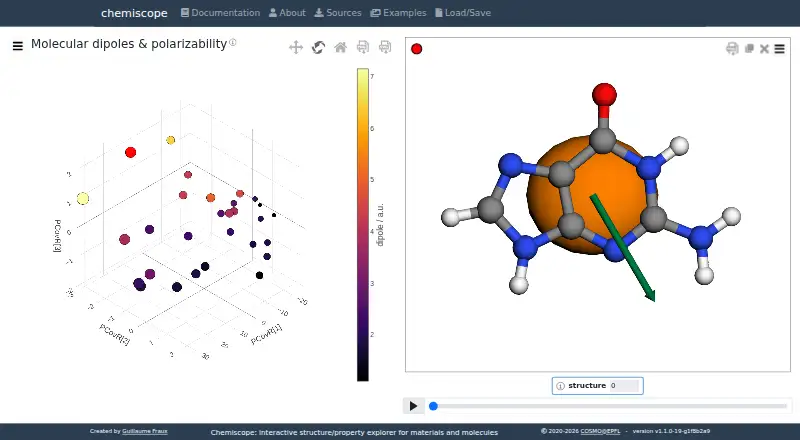
Chemiscope is a free, open-source web tool for exploring materials and molecular databases and examining relationships between structures and their properties. Its interface combines a 3D chemical structure viewer with an interactive 2D or 3D scatter plot. Properties can control plot axes, colors, and point sizes, while selecting a plotted point reveals its structure and selecting a structure identifies its plotted point. The viewer can color atoms by atomic properties and show force vectors or tensor ellipsoids. Documentation describes dynamic loading and plot resampling for databases containing up to hundreds of thousands of structures. For maps above 50,000 points, adaptive resolution shows fewer points while zoomed out and adds points during zooming. A Python package creates Chemiscope JSON inputs and supports notebooks in Jupyter, JupyterLab, VS Code, marimo, and Google Colab. Datasets can be embedded in Streamlit or Sphinx documentation, shared as JSON, loaded from public URLs, or distributed as standalone HTML. The offline HTML viewer does not handle compressed .json.gz files.
Who it suits
Chemiscope suits researchers and software projects working with materials or molecules. It is also useful for people who need interactive notebook, documentation, or web-based visualizations.
What it does well
- Free and open source under the BSD license
- Combines 3D structures with interactive 2D or 3D plots
- Supports Jupyter, JupyterLab, VS Code, marimo, and Colab
- Can embed visualizations in Streamlit and Sphinx
- Handles databases of up to hundreds of thousands of structures
What to know first
- Standalone HTML does not support compressed .json.gz files
- Large maps show only a subset while zoomed out
- No separate native desktop platform is listed
Plans
| Plan | Billed and limits | Price |
|---|---|---|
| Chemiscope | Free and open source · BSD 3-Clause license | Free |
As chemiscope.org lists them, read 11 Oct 2026. The maker's own page has the final word.
Verdict
Chemiscope brings linked structure and property views into a free, open-source workflow. Its notebook integrations, embedding options, and large-database features make it suited to research visualization, with compressed JSON files excluded from the offline viewer.
Facts from Chemiscope's own pages
- Atom data
- The structure viewer can color atoms by atomic properties and display additional data such as force vectors and tensor ellipsoids. · chemiscope.org, 11 Oct 2026
- Dashboard type
- interactive · chemiscope.org, 23 Sept 2026
- Embedding
- Chemiscope can be embedded as a component in Streamlit applications and in Sphinx or Sphinx-Gallery documentation. · chemiscope.org, 11 Oct 2026
- Free plan
- Yes · chemiscope.org, 23 Sept 2026
- Integrations
- The notebook widget works in Jupyter, JupyterLab, VS Code, marimo, and Google Colab without a separate frontend extension installation. · chemiscope.org, 11 Oct 2026
- Large-map limit
- For datasets with more than 50,000 points, adaptive resolution displays only a subset while zoomed out and adds points as the user zooms in. · chemiscope.org, 11 Oct 2026
- License and audience
- Chemiscope is free and open source under the BSD license, and is presented for research and software projects involving materials and molecules. · chemiscope.org, 11 Oct 2026
- Offline limitation
- The standalone HTML visualizer supports JSON files but not compressed JSON files ending in .json.gz. · chemiscope.org, 11 Oct 2026
- Platform
- web · chemiscope.org, 23 Sept 2026
- Property display
- Properties can be mapped to plot axes, color, and point size; users can select points to show corresponding structures and vice versa. · chemiscope.org, 11 Oct 2026
- Purpose
- Chemiscope interactively explores materials and molecular databases to help researchers find structure-property correlations. · chemiscope.org, 11 Oct 2026
- Python
- The Python package creates Chemiscope JSON inputs and provides functions to show datasets interactively in notebooks. · chemiscope.org, 11 Oct 2026
- Scale
- The documentation says Chemiscope is designed for databases of up to hundreds of thousands of structures, with dynamic structure loading and plot resampling. · chemiscope.org, 11 Oct 2026
- Security
- The opened official pages do not state security certifications, compliance claims, or a security policy. · chemiscope.org, 11 Oct 2026
- Sharing
- Users can share datasets as JSON files, load them from public URLs in the online viewer, or distribute an offline standalone HTML visualizer. · chemiscope.org, 11 Oct 2026
- Support
- The project README directs users to open a GitHub issue or email the developers for help. · github.com, 11 Oct 2026
- Visualization
- It combines a 3D chemical structure viewer with an interactive 2D or 3D scatter plot of associated properties. · chemiscope.org, 11 Oct 2026
Where Chemiscope stands on Freedom251
- Data Visualization Software#46 of 98