Freedom251 › Kubernetes Monitoring
avuru obs
What avuru obs is
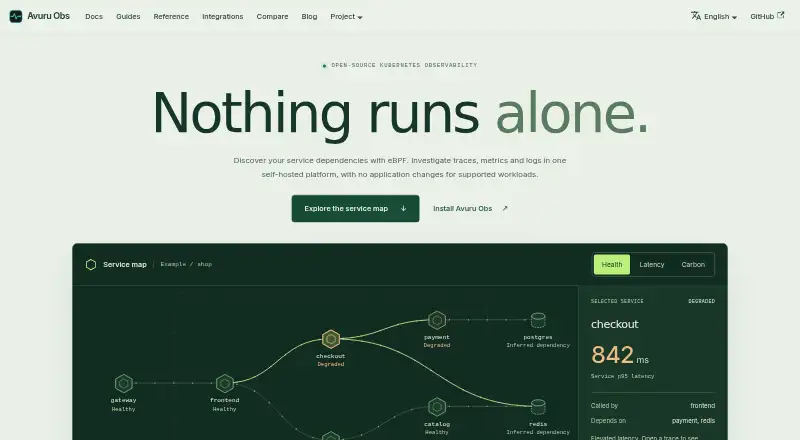
Avuru Obs is a free, open-source Kubernetes observability platform designed for self-hosted use. It brings traces, metrics, and logs into one interface and ClickHouse store to support cross-signal investigation. Its eBPF sensor discovers supported traffic without application changes, though coverage depends on the kernel, runtime, and protocols. A service map displays callers, downstream services, inferred datastores, and service health or latency context. Existing OpenTelemetry data can reach the gateway over OTLP/HTTP or OTLP/gRPC. The gateway can also accept Jaeger, Zipkin, Prometheus remote-write, and Loki push, though each of those protocols is disabled by default. A Grafana data source provides service RED, health, trace search, and cross-zone traffic. The open edition includes OIDC single sign-on and project roles, and authentication is enabled by default. Telemetry storage is self-hosted. Gateway configuration drops model prompt and completion content by default. Green, cost, mesh, and AI modules are off by default, while CPU profiling is experimental and opt-in. Installation requires Helm, a reachable Kubernetes context, persistent ClickHouse storage, and compatible Linux nodes. The project uses the AGPL-3.0 license.
Who it suits
Avuru Obs suits teams running Kubernetes who want to investigate traces, metrics, and logs in a self-hosted system. Its ingestion options and service map may help teams tracing service dependencies and traffic.
What it does well
- Free, open-source AGPL-3.0 edition
- Combines traces, metrics, and logs
- eBPF discovery requires no application changes
- Includes OIDC single sign-on and project roles
- Gateway drops model prompts and completions by default
What to know first
- Requires Helm and a reachable Kubernetes context
- Needs persistent storage for ClickHouse
- Some ingest protocols are disabled by default
- CPU profiling is experimental and opt-in
Limits
Coverage from the eBPF sensor depends on the kernel, runtime, and protocols. Green, cost, mesh, and AI modules are off by default, and CPU profiling is experimental and opt-in.
Plans
| Plan | Billed and limits | Price |
|---|---|---|
| AGPL-3.0 open-source edition | Self-hosted · Kubernetes observability platform | Free |
As avuruobs.io lists them, read 5 Oct 2026. The maker's own page has the final word.
Getting started
- Prepare a reachable Kubernetes context, compatible Linux nodes, and persistent storage for ClickHouse.
- Install Avuru Obs with Helm.
- Send OpenTelemetry data to the gateway over OTLP/HTTP on port 4318 or OTLP/gRPC on port 4317.
- Enable any desired Jaeger, Zipkin, Prometheus remote-write, or Loki push protocol, which is disabled by default.
Verdict
Avuru Obs offers cross-signal investigation and dependency mapping for self-hosted Kubernetes deployments. Check its installation prerequisites and the default-off status of optional ingest protocols and modules.
Questions
How much does Avuru Obs cost?
Its AGPL-3.0 open-source edition is free, listed as free.
Where does it run?
Avuru Obs is self-hosted for Kubernetes. Its installation guide lists Helm, a reachable Kubernetes context, persistent ClickHouse storage, and compatible Linux nodes as prerequisites.
Can I send OpenTelemetry data to it?
Yes. The gateway accepts OTLP/HTTP on port 4318 and OTLP/gRPC on port 4317.
What other ingest protocols does it accept?
It accepts Jaeger, Zipkin, Prometheus remote-write, and Loki push, but each is disabled by default.
Is Avuru Obs open source?
Yes. The project is licensed under AGPL-3.0.
Facts from avuru obs's own pages
- Collection
- Its eBPF sensor discovers supported traffic without application changes; coverage depends on the kernel, runtime, and protocols. · avuruobs.io, 5 Oct 2026
- Data redaction
- Gateway configuration drops model prompt and completion content by default, whether or not the AI module is enabled. · avuruobs.io, 5 Oct 2026
- Deployment requirements
- The installation guide lists Helm, a reachable Kubernetes context, persistent storage for ClickHouse, and compatible Linux nodes as prerequisites. · avuruobs.io, 5 Oct 2026
- Integrations
- A Grafana data source provides service RED, health, trace search, and cross-zone traffic; its backend plugin keeps the API token out of the browser. · avuruobs.io, 5 Oct 2026
- License
- The project is licensed under AGPL-3.0. · avuruobs.io, 5 Oct 2026
- OpenTelemetry
- Existing OpenTelemetry data can be sent to the gateway over OTLP/HTTP on port 4318 or OTLP/gRPC on port 4317. · avuruobs.io, 5 Oct 2026
- Optional modules
- Green, cost, mesh, and AI modules are off by default; CPU profiling is described as experimental and opt-in. · avuruobs.io, 5 Oct 2026
- Other ingest protocols
- The gateway also accepts Jaeger, Zipkin, Prometheus remote-write, and Loki push protocols, each disabled by default. · avuruobs.io, 5 Oct 2026
- Purpose
- Avuru Obs is an open-source, self-hosted Kubernetes observability platform for discovering service dependencies and investigating telemetry. · avuruobs.io, 5 Oct 2026
- Security
- The open edition includes OIDC single sign-on and project roles, and the product describes authentication as enabled by default. · avuruobs.io, 5 Oct 2026
- Service map
- The service map shows callers, downstream services, inferred datastores, and service health or latency context. · avuruobs.io, 5 Oct 2026
- Signals
- It brings traces, metrics, and logs together in one interface and ClickHouse store for cross-signal investigation. · avuruobs.io, 5 Oct 2026
- Telemetry storage
- Telemetry storage is self-hosted; configured exporters, webhooks, or an MCP-connected assistant can send selected data to external destinations. · avuruobs.io, 5 Oct 2026
Where avuru obs stands on Freedom251
- Kubernetes Monitoring#4 of 54