Freedom251 › DNS Monitoring Software
dnshealth_exporter
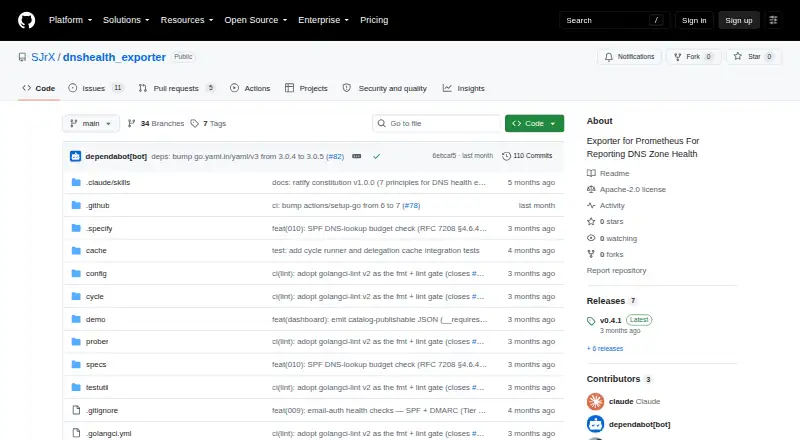
What dnshealth_exporter is
dnshealth_exporter is an open-source exporter for monitoring DNS zone health on Linux and self-hosted systems. It exposes Prometheus metrics for dashboarding and alerting, with intended signals covering parent delegation, nameserver consistency, SOA correctness, and MX validity. Implemented checks include SOA, recursion availability, and glue consistency, and the project is marked as early development.
Metrics are served at http://localhost:9199/metrics. Probes run on a configurable interval that defaults to 60 seconds; the endpoint returns HTTP 503 until the first probe cycle finishes. Configure the exporter with a YAML file, then reload changes without restarting by sending SIGHUP or posting to /-/reload. The README documents building from source with Go 1.26 or later and includes an example systemd service with restart-on-failure and reload support.
Prometheus metrics can feed Grafana dashboards and alerting, with thresholds and rules handled in Grafana or Alertmanager. A Docker Compose demo brings up the exporter, Prometheus, Grafana with a pre-imported dashboard, and a CoreDNS hierarchy. The repository lists the Apache License 2.0 and includes a demo walkthrough and troubleshooting instructions.
Who it suits
It suits Linux or self-hosted operators who want DNS health signals exposed as Prometheus metrics. Teams using Grafana or Alertmanager can apply their own thresholds and alert rules to those metrics.
What it does well
- Open-source software under Apache License 2.0
- Checks SOA, recursion availability, and glue consistency
- Metrics integrate with Prometheus-based dashboarding and alerting
- Configuration reloads without restarting the exporter
- Docker Compose demo includes Grafana and a CoreDNS hierarchy
What to know first
- Project is marked as early development
- Metrics endpoint returns HTTP 503 before the first probe completes
- Building from source requires Go 1.26 or later
Limits
The project is marked as early development. The metrics endpoint returns HTTP 503 until the first probe cycle completes.
Plans
| Plan | Billed and limits | Price |
|---|---|---|
| Open-source software | No paid tiers or usage limits stated | Free |
As github.com lists them, read 4 Oct 2026. The maker's own page has the final word.
Getting started
- Open the project website on GitHub
- Build from source with Go 1.26 or later
- Prepare a YAML configuration file
- Run the exporter on Linux or in a self-hosted environment
- Use the bundled Docker Compose demo to run the exporter, Prometheus, Grafana, and CoreDNS
Verdict
Choose dnshealth_exporter if you run Linux or self-hosted infrastructure and want DNS checks exposed to Prometheus, Grafana, or Alertmanager. Its early-development status and initial HTTP 503 period are worth accounting for when planning operations.
Questions
Is dnshealth_exporter free?
Yes. The listed Open-source software plan is free.
What does it check?
Implemented checks cover SOA, recursion availability, and glue consistency. Intended signals also include parent delegation, nameserver consistency, SOA correctness, and MX validity.
Where are its metrics available?
The exporter serves them at http://localhost:9199/metrics, refreshing on a configurable interval that defaults to 60 seconds.
Can I use it with Grafana?
Yes. Prometheus metrics can be used with Grafana dashboards and alerting; thresholds and rules are handled in Grafana or Alertmanager.
How do I install it?
The README documents building from source with Go 1.26 or later and running the exporter with a YAML configuration file.
What license does it use?
The repository lists the Apache License 2.0.
Facts from dnshealth_exporter's own pages
- Checks
- The README says SOA, recursion-available, and glue consistency checks are implemented; the project is marked early development. · github.com, 4 Oct 2026
- Configuration
- Configuration can be reloaded without restarting, either by sending SIGHUP or by posting to /-/reload. · github.com, 4 Oct 2026
- Demo
- A bundled Docker Compose demo runs the exporter, Prometheus, Grafana with a pre-imported dashboard, and a CoreDNS hierarchy. · github.com, 4 Oct 2026
- Installation
- The README documents building from source with Go 1.26 or later and running the exporter with a YAML configuration file. · github.com, 4 Oct 2026
- Integrations
- The project describes using Prometheus metrics with Grafana dashboards and alerting, with thresholds and alert rules handled in Grafana or Alertmanager. · github.com, 4 Oct 2026
- Intended use
- It is designed to surface DNS health signals such as parent delegation, nameserver consistency, SOA correctness, and MX validity. · github.com, 4 Oct 2026
- Limits
- The README says the metrics endpoint returns HTTP 503 until the first probe cycle completes. · github.com, 4 Oct 2026
- Metrics
- The exporter serves metrics at the local endpoint http://localhost:9199/metrics, refreshing on a configurable probe interval that defaults to 60 seconds. · github.com, 4 Oct 2026
- Operations
- The README provides an example systemd service configuration with restart-on-failure and reload support. · github.com, 4 Oct 2026
- Purpose
- dnshealth_exporter monitors DNS zone health and exposes Prometheus metrics for dashboards and alerting. · github.com, 4 Oct 2026
- Security
- The repository lists an Apache License 2.0 and does not state security certifications or compliance claims in the README. · github.com, 4 Oct 2026
- Support
- The README provides a demo walkthrough and troubleshooting instructions but does not specify a support service or response commitment. · github.com, 4 Oct 2026
Where dnshealth_exporter stands on Freedom251
- DNS Monitoring Software#8 of 37