Freedom251 › Bandwidth Monitoring Software
Bandwidth Monitor
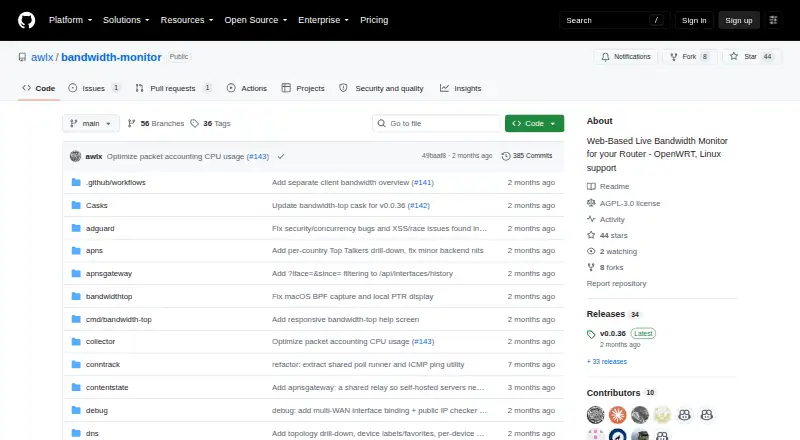
What Bandwidth Monitor is
Bandwidth Monitor is a free, open-source dashboard for watching network activity on Linux routers and hosts. It runs as a self-hosted daemon with an embedded web interface, showing rates and history for each interface, top traffic sources, host details, and protocol and IP-version breakdowns. Network views also cover conntrack and NAT state, client topology, latency checks, and a live traffic map. Diagnostic tools include server-side speed tests, traceroute, DNS and resolver checks, path MTU discovery, public-address checks, and TCP tests. Optional integrations connect DNS services AdGuard Home, NextDNS, and Pi-hole, as well as UniFi and Omada for WiFi. The daemon is Linux-only and distributed as one Go binary, with packages listed for Debian, Ubuntu, Raspbian, Fedora, RHEL, Arch Linux, OpenWrt, and Nix. Its API offers JSON endpoints under /api and a Server-Sent Events stream for live dashboard data. Companion clients include macOS menu-bar tools, a Windows tray widget, and GNOME/AppIndicator panels. An independently developed iOS client displays live interface rates and supports Lock Screen widgets and Live Activities, but needs access to a running instance. Interface and conntrack/NAT statistics require CAP_NET_ADMIN or root; some capture and diagnostic features require CAP_NET_RAW or root. The project is licensed under GNU AGPL v3.0.
Who it suits
Bandwidth Monitor suits people who administer Linux routers or hosts and want a self-hosted view of traffic, network state, and diagnostics. It can also serve users who want companion panels or clients on macOS, Windows, GNOME, or iOS, provided the Linux daemon is running and reachable where required.
What it does well
- Free and open source under GNU AGPL v3.0.
- Shows interface rates, top talkers, host details, and traffic history.
- Includes network diagnostics such as traceroute and DNS checks.
- Optional integrations cover DNS and WiFi services.
- Provides JSON endpoints and a live Server-Sent Events stream.
- The project says it uses no telemetry or analytics.
What to know first
- The dashboard daemon runs on Linux only.
- Some statistics require CAP_NET_ADMIN or root.
- Some capture and diagnostic functions require CAP_NET_RAW or root.
- The iOS client requires a reachable running instance.
Limits
Bandwidth Monitor is free, with no paid tier listed. Interface statistics and conntrack/NAT require CAP_NET_ADMIN or root, while top-talkers capture and ICMP latency or traceroute need CAP_NET_RAW or root.
Getting started
- Visit https://github.com/awlx/bandwidth-monitor.
- Install the Linux daemon using a package listed for your distribution or the Go binary.
- Run the daemon on a Linux router or host.
- Connect through its embedded web interface or HTTP API.
- Optionally connect a documented companion client to the daemon.
Verdict
Pick Bandwidth Monitor if you want a free, self-hosted Linux dashboard with traffic views, network diagnostics, and an API. Look elsewhere if you need a daemon that runs on macOS, Windows, or iOS, or cannot grant the required network permissions for some functions.
Questions
How much does Bandwidth Monitor cost?
It is free and open source.
Is Bandwidth Monitor open source?
Yes. It is licensed under GNU AGPL v3.0, which the repository says requires source-code availability when modified software is made available over a network.
Which operating systems can run the dashboard daemon?
The dashboard daemon is Linux-only. Packages are listed for Debian, Ubuntu, Raspbian, Fedora, RHEL, Arch Linux, OpenWrt, and Nix.
Does it have companion clients?
Documented options include SwiftBar and xbar clients for macOS, a Windows tray widget, GNOME/AppIndicator panels, and an independently developed iOS client.
What integrations are available?
Optional DNS integrations include AdGuard Home, NextDNS, and Pi-hole. WiFi integrations include UniFi and Omada.
Who makes Bandwidth Monitor?
The GitHub profile identifies awlx as Annika Wickert and lists Munich.
Facts from Bandwidth Monitor's own pages
- API
- The dashboard exposes JSON endpoints and a Server-Sent Events stream used by the browser dashboard and companion clients. · github.com, 11 Oct 2026
- Companion clients
- The project documents SwiftBar and xbar clients for macOS, a Windows system tray widget, and GNOME/AppIndicator panels; clients consume the daemon's HTTP API. · github.com, 4 Oct 2026
- Deployment
- The dashboard daemon supports Linux, while the separately packaged bandwidth-top terminal viewer supports Linux and macOS. · github.com, 11 Oct 2026
- Desktop clients
- Companion clients are available for SwiftBar or xbar, Windows tray, and GNOME or AppIndicator panels. · github.com, 11 Oct 2026
- Diagnostics
- Diagnostics include server-side speed tests, traceroute, DNS and resolver checks, path MTU discovery, public-address checks, and TCP tests. · github.com, 11 Oct 2026
- Integrations
- Optional DNS integrations include AdGuard Home, NextDNS, and Pi-hole; WiFi integrations include UniFi and Omada. · github.com, 11 Oct 2026
- iOS client
- An independently developed iOS app shows live traffic and supports Lock Screen and Dynamic Island Live Activities. · github.com, 11 Oct 2026
- License
- The project is licensed under GNU Affero General Public License version 3.0. · github.com, 11 Oct 2026
- Maker
- The GitHub account awlx identifies its owner as Annika Wickert and lists Munich. · github.com, 11 Oct 2026
- Network visibility
- Features include conntrack and NAT state, client topology, continuous latency checks, and a live traffic map. · github.com, 11 Oct 2026
- Permissions
- Interface statistics and conntrack/NAT require CAP_NET_ADMIN or root, while top talkers and ICMP latency or traceroute require CAP_NET_RAW or root. · github.com, 11 Oct 2026
- Purpose
- Bandwidth Monitor is a self-hosted, real-time network dashboard for Linux. · github.com, 11 Oct 2026
- Security and privacy
- The project says it has no telemetry, analytics, crash reporting, or update checks; configured integrations and built-in functions can make outbound network requests. · github.com, 11 Oct 2026
- Terminal viewer
- The separately packaged bandwidth-top terminal traffic viewer supports Linux and macOS, while the dashboard daemon is Linux-only. · github.com, 4 Oct 2026
- Traffic monitoring
- It shows per-interface traffic rates and history, top talkers, host details, protocol and IP-version breakdowns, reverse DNS, and optional GeoIP data. · github.com, 11 Oct 2026
Where Bandwidth Monitor stands on Freedom251
- Bandwidth Monitoring Software#7 of 33