Some links on this page are affiliate links: if you buy through them we may earn a commission, at no extra cost to you.
Configuration Manager hardware reporting is not one universal report. It is a collection of built-in reports, SQL Server Reporting Services (SSRS) reports, queries, collections, Resource Explorer views, and CMPivot investigations that use hardware inventory collected from Configuration Manager clients.
Use the built-in report catalog for common questions, Resource Explorer for one device, SSRS for repeatable operational reporting, Power BI for interactive dashboards, and CMPivot when current device state matters more than historical reporting. The result is only as reliable as the inventory classes enabled in your site and the timestamp of the last successfully processed hardware scan.
What counts as a Configuration Manager hardware report?
In Microsoft Configuration Manager, formerly known as SCCM, “hardware related reports” describes a reporting category rather than a guaranteed report name or folder. Exact built-in report names vary by current-branch release, installed features, enabled inventory classes, and site configuration. Always search the report catalog in your own console instead of assuming that a report listed in an older guide exists unchanged.
Hardware inventory can provide information about:
| Area | Typical information |
|---|---|
| Device identity | Computer name, resource ID, manufacturer, model, serial number, and asset tag where reported reliably |
| Processor | CPU name, speed, socket, core information, and processor count |
| Memory | Total physical memory and individual memory modules |
| Firmware | BIOS version, SMBIOS version, and release date |
| Storage | Physical disks, logical volumes, capacity, free space, and media type |
| Operating system | Edition, version, architecture, and installation details |
| Network | Network adapters, MAC addresses, IP configuration, and related network data |
| Other components | Chassis, displays, services, SCSI controllers, peripherals, and vendor-specific classes |
| Inventory health | Last hardware inventory time, workstation status, and hardware history |
Microsoft documents the hardware-inventory data flow and the ways to consume it in its hardware inventory overview. The actual fields available in your environment depend on the classes and properties enabled in client settings.
#1 Best Overall

- The Ultimate Engineering Slide Chart - A “MUST HAVE” for Engineers, Designers, Drafters, and Machinists
- Includes technical information from many of the quick references that are commonly found in the work areas of Designers, Engineers, and Machinists
- Specifications for both imperial (inch) and metric fasteners, with thread sizes, tap drill sizes, and standard markings
- Fraction to decimal to millimeters conversion chart
- GD&T, Surface Finish, Welding Symbols, Wrench Clearances, Durometer, and Hardness Conversion
Prerequisites: why a report may be empty or incomplete
Before designing a query, confirm the data exists. Configuration Manager hardware reporting normally requires:
- Hardware inventory is enabled in the applicable client settings.
- The required hardware classes and properties are enabled.
- The client is assigned to the intended Configuration Manager site.
- The client has completed a hardware inventory cycle.
- The inventory payload reached a management point and was processed by the site.
- The report user has permission to run the report and view its collection scope.
- An SSRS Reporting Services point is available for conventional SSRS reports.
A client can be online, active, and compliant while its stored hardware inventory is old. Reports generally show the latest inventory successfully processed into the site database—not necessarily the device’s present state.
Enable or extend hardware inventory
- Open the Configuration Manager console.
- Go to Administration → Client Settings.
- Edit the relevant client settings object.
- Open Hardware Inventory and enable inventory if necessary.
- Set an appropriate inventory schedule.
- Select Set Classes.
- Enable only the classes and properties required by your reports.
- Deploy the settings to the intended collection.
Enabling more classes produces richer reports, but it also increases client processing, network traffic, database growth, and query complexity. Hardware inventory is extensible, so a custom class can create site-specific views and columns. A query copied from another environment may therefore require changes. See Microsoft’s documentation for hardware inventory views and schema views.
Recommended Free Tools
Find and run built-in hardware reports
- Open the Configuration Manager console.
- Go to Monitoring.
- Expand Reporting.
- Open Reports.
- Search or browse for terms such as hardware, asset, computer, operating system, inventory, client status, or device collection.
- Run a report and provide any requested collection, site, model, manufacturer, or date parameters.
Useful report categories commonly include computer inventory, operating-system information, client status, asset information, and collection summaries. Availability depends on the Configuration Manager release and installed features. Microsoft maintains a list of built-in reports, and the SQL statements behind those reports can often provide a useful starting point for a customized report.
Inspect one computer with Resource Explorer
Resource Explorer is usually faster than writing a report when you need to inspect one device.
- Go to Assets and Compliance → Devices, or open a device collection.
- Select the computer.
- Choose Start → Resource Explorer from the ribbon.
- Expand Hardware to view the latest stored inventory.
- Expand Hardware History to review recorded changes.
- Open Workstation Status and check the last hardware inventory time.
Resource Explorer does not become useful until the client completes a hardware inventory cycle. Hardware History represents inventoried changes, not an unlimited record of every prior device state. The documented default for inactive hardware inventory history is 90 days through the Delete Aged Inventory History maintenance task, although administrators can adjust retention. See Microsoft’s Resource Explorer documentation.
Trigger and verify a hardware inventory cycle
To request fresh data, trigger the Hardware Inventory Cycle from the Configuration Manager control-panel applet on the client. You can also use the client notification mechanism in the console when the device is reachable and the required permissions are available.
Rank #2

- Screw Types Chart Informational Poster Hardware Reference
Do not expect an immediate report update. The client must collect the data, create and upload the inventory message, communicate with a management point, and wait for site processing before reports and Resource Explorer reflect it.
Check these locations when troubleshooting:
InventoryAgent.log— hardware collection, inventory actions, and reporting activity on the client.Dataldr.log— processing by the site database loader.- Management-point and IIS logs — whether the inventory payload reached the management point.
After processing completes, reopen Resource Explorer and compare the timestamp with the report’s freshness requirement. A report should expose that timestamp rather than presenting old inventory as current.
How hardware inventory reaches the database
- Client settings enable hardware inventory and define the schedule and classes.
- The client runs a hardware inventory cycle.
- The client sends inventory data to a management point.
- The management point forwards the data to the site server.
- Configuration Manager processes and stores the data in the site database.
- Reports, queries, collections, Resource Explorer, and some CMPivot queries consume the resulting data.
The first inventory report from a client is a full inventory. Later reports are normally delta inventories. If required delta information is unavailable, Configuration Manager can reject later deltas and request another full inventory cycle. This is one reason a device may continue to appear active while its hardware information remains stale.
Important SQL views for hardware reports
Use supported Configuration Manager views rather than relying on undocumented internal tables. Representative view families include:
The Tool Desk
Outbyte PC Repair FREERepair Windows errors before they cause bigger problemsFix Now →Outbyte Driver Updater FREEScan for outdated or missing drivers - takes under a minuteDriver Scan →| Reporting need | Representative view |
|---|---|
| Computer system | v_GS_COMPUTER_SYSTEM |
| Computer identity and product data | v_GS_COMPUTER_SYSTEM_PRODUCT |
| Processor | v_GS_PROCESSOR |
| Physical memory | v_GS_PHYSICAL_MEMORY |
| BIOS | v_GS_PC_BIOS |
| Operating system | v_GS_OPERATING_SYSTEM |
| Physical disks | v_GS_DISK |
| Logical disks | v_GS_LOGICAL_DISK |
| Chassis | v_GS_SYSTEM_ENCLOSURE |
| Services | v_GS_SERVICE |
| Network configuration | v_GS_NETWORK_ADAPTER_CONFIGURATION |
| Inventory status | v_GS_WORKSTATION_STATUS |
| Inventory schema | v_InventoryClass, v_GroupMap, and v_GroupAttributeMap |
Most hardware views use the v_GS_ prefix, with corresponding history views commonly using v_HS_. The principal join key is usually ResourceID:
FROM v_R_System AS rs
INNER JOIN v_GS_COMPUTER_SYSTEM AS cs
    ON cs.ResourceID = rs.ResourceID
Verify view availability, column names, and data types in the target site. Extended inventory means there is no completely version-independent hardware query.
Prevent duplicate rows: define the report’s grain
Many hardware classes are one-to-many. A computer may have several disks, memory modules, processors, or network adapters. Joining all of those views directly can multiply rows. A device with four disks and two memory modules can already produce eight combinations before processors and adapters are added.
Rank #3

- Toolbox Must Have: The toolbox reference card has tons of information, including SAE to metric units conversion, SAE and metric tap drill sizes, SAE and metric wrench size chart of bolts, ruler in cm and inch, fractional, letter& number drill sizes in one sheet and so on.
- High Quality Durable Materials: The reference card is printed on 300 gram coated paper, and laminated with a 12 micron PET + EVA thermoplastic film. It is sturdy and durable, so you don't have to worry about damage caused by friction between the product and tools.
- Indoor Use: It can be used in garage workbench, place on the worktable anywhere. When you do your project, it can be a great tool for you, save your time.
- Outdoor Use: The size of this reference card is 11.8” X 7.9” (30cm X 20cm), with a thickness of only 1 millimeter. It is highly portable. Most importantly, it can also play a significant role when placed in a toolbox for outdoor use. Saving you from looking up unit conversions on your phone.
- Applicable People: The mat fit for engineers, DIY enthusiasts, carpenters, maintenance workers and so on. It helps users easily perform conversions without complex calculations.
Choose and label the intended grain:
- One row per device — summarize or select one value from component classes.
- One row per disk — use a disk detail dataset.
- One row per memory module — use a memory detail dataset.
- One row per processor — use a processor detail dataset.
- One row per network adapter — use a network detail dataset.
For a device summary, aggregate each one-to-many class before joining, use OUTER APPLY where appropriate, or build separate datasets and subreports. A normalized detail report is often more accurate than forcing every component into one wide row.
Crashes, No Sound, or Screen Glitches?
Random freezes, missing sound and display glitches usually trace back to one bad driver. Find and replace yours safely.Free scan · under a minuteWindows Errors? Fix Them Before They Spread
Repair common Windows errors and clear accumulated junk for a smoother, more stable PC - no reinstall needed.Free scan · no reinstallExample SQL report patterns
These examples are starting patterns, not universal drop-in queries. Confirm the actual columns and types in your site before publishing or deploying them.
One row per computer: basic hardware summary
SELECT
    rs.Name0 AS DeviceName,
    rs.ResourceID,
    cs.Manufacturer0 AS Manufacturer,
    cs.Model0 AS Model,
    cs.TotalPhysicalMemory0 AS TotalPhysicalMemoryBytes,
    os.Caption0 AS OperatingSystem,
    os.Version0 AS OperatingSystemVersion,
    bios.SMBIOSBIOSVersion0 AS BIOSVersion,
    ws.LastHWScan
FROM v_R_System AS rs
LEFT JOIN v_GS_COMPUTER_SYSTEM AS cs
    ON cs.ResourceID = rs.ResourceID
LEFT JOIN v_GS_OPERATING_SYSTEM AS os
    ON os.ResourceID = rs.ResourceID
LEFT JOIN v_GS_PC_BIOS AS bios
    ON bios.ResourceID = rs.ResourceID
LEFT JOIN v_GS_WORKSTATION_STATUS AS ws
    ON ws.ResourceID = rs.ResourceID
WHERE rs.Obsolete0 = 0;
LEFT JOIN retains devices whose inventory is incomplete. Add collection filtering, client status, and null handling according to the report’s purpose. Include LastHWScan so readers can distinguish an old record from a current one.
Inventory freshness
SELECT
    rs.Name0 AS DeviceName,
    rs.ResourceID,
    ws.LastHWScan,
    DATEDIFF(DAY, ws.LastHWScan, GETDATE()) AS DaysSinceHardwareInventory
FROM v_R_System AS rs
LEFT JOIN v_GS_WORKSTATION_STATUS AS ws
    ON ws.ResourceID = rs.ResourceID
WHERE rs.Obsolete0 = 0;
In production, add a report parameter for the acceptable age threshold. Account for null timestamps, SQL Server time, time zones, and delays between client upload and site processing. A null date should be categorized explicitly as “never reported” or “unknown,” not silently treated as fresh.
Manufacturer and model counts
SELECT
    cs.Manufacturer0 AS Manufacturer,
    cs.Model0 AS Model,
    COUNT(*) AS DeviceCount
FROM v_R_System AS rs
INNER JOIN v_GS_COMPUTER_SYSTEM AS cs
    ON cs.ResourceID = rs.ResourceID
WHERE rs.Obsolete0 = 0
GROUP BY
    cs.Manufacturer0,
    cs.Model0
ORDER BY
    DeviceCount DESC;
Normalize manufacturer and model values before grouping where practical. Firmware revisions, punctuation, whitespace, and vendor naming differences can split one physical model into several apparent models. Virtual machines may also report generic or hypervisor-defined values that should not be counted as physical assets without an explicit rule.
What’s actually slowing this PC down?
Pick the symptom - the matching free tool is one click away.
Memory and disk reports
A memory-module report should state that it returns one row per physical memory module. For a total-memory report, aggregate memory by ResourceID before joining it to the device-level dataset.
Disk reporting must distinguish physical disks from logical volumes and capacity from free space. Also label whether values use decimal units or binary units, and separate fixed, removable, mounted, and virtual media where the available inventory fields support that distinction. Capacity inventory alone does not establish storage health or performance.
Rank #4
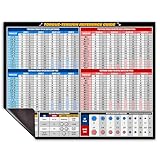
- 🔩 Covers SAE & Metric Sizing – Includes screw size chart for UNC, UNF, and metric bolts with thread chaser torque specs—perfect for wheel torque chart and bolt size reference.
- 🧲 Magnet Tools for Mechanics – A must-have shop magnet that sticks to your machinist toolbox, metal cart, or tool chest. Great for toolbox organizational magnets and garage setups.
- 🔧 Fast Wrench Interchange – Includes wrench interchange and bolt gauge sizing tool info, ideal for mechanic set users and special tools for mechanic work.
- 💪 Grease-Resistant & Durable – Waterproof and built to last in shop supplies for mechanic settings. Use as a tool sticker or shop magnet that holds up under tough conditions.
- 🛠️ Compact Tool Poster Size – This conversion chart magnet is 8.5" x 11" and ideal for tight spaces. Use it near magnetic parts tray, drill tap chart, or other magnet tools.
Useful report designs
- Device hardware summary with manufacturer, model, operating system, BIOS, memory, and last inventory time.
- Manufacturer and model distribution for refresh planning.
- BIOS-version distribution or devices below an approved BIOS baseline.
- Memory-capacity distribution.
- Disk capacity and free-space detail by logical volume.
- Devices whose last hardware inventory exceeds an age threshold.
- Hardware History changes over time, subject to configured retention.
- Devices with a specified processor, disk, chassis type, service, or network adapter.
- Warranty, dock, or vendor data where a custom inventory class has been configured.
Reporting identifies devices; it does not automatically repair BIOS, firmware, storage, or inventory problems. Use collections, deployments, scripts, configuration baselines, or CMPivot to take action after identifying the target devices.
Create a custom SSRS report
For conventional Configuration Manager reporting, confirm that the site has a configured Reporting Services point and that the SSRS report server is working. A practical workflow is:
Quick wins for a faster PC:
Scan for outdated or missing drivers - takes under a minuteDriver Scan →Repair Windows errors before they cause bigger problemsFix Now →- Go to Monitoring → Reporting in the console.
- Choose Create Reports.
- Select a SQL-based report.
- Choose the report folder.
- Open Report Builder.
- Configure the Configuration Manager data source.
- Create a dataset using supported Configuration Manager views.
- Add parameters such as collection, manufacturer, model, or maximum inventory age.
- Add a table, matrix, chart, or subreport.
- Test against a small collection or limited result set.
- Save the report and verify it in SSRS and the Configuration Manager console.
Parameterize scope instead of returning the entire estate by default. Validate collection permissions, report-folder permissions, and the SSRS data-source account. A query can work in SQL Server Management Studio yet fail in SSRS because the report data source, credentials, database context, or permissions differ. Practical SSRS setup guidance is available from System Center Dudes’ Report Builder guide; SSRS and Reporting Services point requirements should also be checked against your current Configuration Manager and SQL Server versions.
SSRS, Power BI, CMPivot, queries, or collections?
| Tool | Best use | Main limitation |
|---|---|---|
| Built-in reports | Common recurring inventory questions with minimal development | Report names, fields, and flexibility vary by release and site |
| Resource Explorer | Detailed inspection of one device and available hardware history | Manual, device-focused, and dependent on collected inventory |
| Custom SSRS | Parameterized, paginated, printable, scheduled operational reports | Requires reporting infrastructure and careful SQL design |
| Power BI | Interactive dashboards, trends, and combining Configuration Manager with other data | Requires refresh, gateway, workspace, governance, and applicable licensing decisions |
| CMPivot | Operational investigation involving online devices and potentially current state | Not a substitute for historical reporting; availability and query support vary |
| Queries and collections | Finding devices and targeting deployments or remediation | Less suitable for polished, scheduled reporting |
Choose SSRS when the organization already uses the Configuration Manager reporting point and needs stable tabular output. Choose Power BI when interactive slicing, trend analysis, or multiple data sources justify its refresh and governance overhead. Power BI Desktop, Power BI Report Server, and the Power BI service are different deployment targets; do not treat them as interchangeable. Licensing depends on the product, tenant, workspace, sharing model, and existing organizational entitlements.
CMPivot versus stored hardware inventory
Use CMPivot for questions such as:
- Which currently connected devices have a particular hardware state?
- What BIOS version does an online device report now?
- Does a device currently have a particular disk or service?
- Can an operational issue be investigated without waiting for the next scheduled inventory cycle?
Use SSRS or another conventional report for historical analysis, scheduled delivery, repeatable metrics, collection-wide trends, and paginated output. CMPivot can query hardware inventory, including extended classes, and its interface distinguishes live results from values based on the last stored hardware inventory scan. Its usefulness depends on online clients, permissions, supported query features, and the distinction between live and cached data. See Microsoft’s CMPivot documentation.
Independent reader supportYour contribution helps us test, update, and keep practical guides available for everyone.Troubleshooting hardware reports
The report returns no rows
- Confirm the target collection contains the expected devices.
- Check that devices are not obsolete or excluded by a status filter.
- Verify hardware inventory is enabled and the required class is selected.
- Check whether a hardware cycle has completed and been processed.
- Confirm the query is connected to the intended primary-site or reporting database.
- Verify that the view and columns exist in the local site schema.
A device is absent from Resource Explorer
Confirm that the selected resource is the correct device and that it has completed at least one hardware inventory cycle. Check client assignment, management-point communication, InventoryAgent.log, and site processing. A device being visible in the console does not prove that hardware inventory has been received.
Free tools Windows power users keep installed
One-click scans. No signup required.
The hardware timestamp is stale
Trigger a hardware inventory cycle, then follow the payload through client, management-point, and site-processing logs. Check for communication failures, rejected delta inventory, inactive clients, and long processing delays. Reopen Resource Explorer only after processing has had time to complete.
Best Value
- Toolbox Must Have: The toolbox reference card has tons of information, including SAE to metric units conversion, SAE and metric tap drill sizes, SAE and metric wrench size chart of bolts, ruler in cm and inch, fractional, letter& number drill sizes in one sheet and so on.
- High Quality Durable Materials: The reference card is printed on 300 gram coated paper, and laminated with a 12 micron PET + EVA thermoplastic film. It is sturdy and durable, so you don't have to worry about damage caused by friction between the product and tools.
- Indoor Use: It can be used in garage workbench, place on the worktable anywhere. When you do your project, it can be a great tool for you, save your time.
- Outdoor Use: The size of this reference card is 11.8” X 7.9” (30cm X 20cm), with a thickness of only 1 millimeter. It is highly portable. Most importantly, it can also play a significant role when placed in a toolbox for outdoor use. Saving you from looking up unit conversions on your phone.
- Applicable People: The mat fit for engineers, DIY enthusiasts, carpenters, maintenance workers and so on. It helps users easily perform conversions without complex calculations.
Values are null or misleading
Null BIOS, serial, model, memory, or asset-tag values may result from firmware, WMI, vendor implementation, virtualization, or an inventory class that is not enabled. “Unknown” does not necessarily mean that the hardware is absent. Virtual machines can report generic manufacturer, model, BIOS, processor, or serial values, and Configuration Manager has limited support for dual-boot computers. Treat serial numbers and asset tags as data requiring validation, especially for physical-asset accounting.
Duplicate devices appear
First check whether the query joined multiple one-to-many classes. Separate detail datasets or aggregate component data before joining. Also check for duplicate resource records, obsolete resources, and inconsistent grouping. Make the report grain explicit instead of applying DISTINCT as a blanket fix; DISTINCT can hide a design error and remove legitimate component rows.
The report works in SSMS but fails in SSRS
Compare the database connection, credentials, execution account, parameters, report user permissions, and collection-security scope. Confirm the SSRS data source points to the intended site database and that the report server and Reporting Services point are configured correctly.
Do these 3 things before closing this tab:
1Repair Windows errors before they cause bigger problems2Fix the driver behind crashes, sound loss and screen glitches3Clear out junk files and repair common Windows errorsCMPivot disagrees with SSRS
The tools may be answering different questions. CMPivot may query an online device directly, while SSRS may show the last stored hardware inventory. Compare timestamps and determine whether each value is live, cached, or processed inventory. Also account for different target collections and query semantics.
A custom class is missing
Confirm that the class was enabled and deployed to the affected clients, that a new inventory cycle completed, and that the corresponding site views or attributes exist. Use the inventory schema views to identify the class and attribute names in that site rather than guessing from another environment.
The report is slow
Limit the default scope, require parameters, return only necessary columns, avoid unnecessary one-to-many joins, and test the query against realistic data volume. Performance depends on site size, indexes, joins, SSRS configuration, and database workload; do not assume that a query that is fast in a small lab will perform well in production.
Security and maintenance
- Use least-privilege access to the reporting data source.
- Apply report-folder and console permissions deliberately.
- Respect collection security so users see only authorized devices.
- Protect serial numbers, MAC addresses, IP information, and other sensitive inventory fields.
- Review retention and database growth when enabling extensive history or custom classes.
- Revalidate custom reports after Configuration Manager updates or schema changes.
- Document whether a report runs against a primary-site database, a central administration site database, or a consolidated reporting database.
- Do not assume that views and columns are identical across sites in a hierarchy.
Should you buy a report pack?
Most organizations can answer basic hardware questions with built-in reports, supported SQL views, SSRS, and tools already included in their Microsoft environment. Paid report packs can save design time when polished dashboards, installation guidance, or support are more valuable than building everything internally. Before purchasing, confirm compatibility with your Configuration Manager, SSRS, Power BI Desktop, or Power BI Report Server versions and verify that the package supports your enabled inventory classes.
For complex environments, consulting may provide more value than a generic report: custom inventory extensions, duplicate-safe data models, manufacturer normalization, warranty or procurement integration, CMDB integration, security trimming, and multi-site reporting often require site-specific design. Commercial options should supplement—not replace—the normal sequence of checking built-in reports, validating inventory freshness, and confirming the local schema.
Conclusion
The most dependable SCCM hardware-reporting approach is a combination of tools. Start with the local built-in report catalog, verify that the required inventory classes are enabled, and include the last hardware inventory timestamp in every operational report. Use Resource Explorer for a single device, supported SQL views and SSRS for repeatable reporting, Power BI for governed interactive dashboards, and CMPivot for live investigation. Keep row grain explicit, avoid naïve one-to-many joins, and treat inventory values as successfully processed observations rather than guaranteed real-time hardware state.
Quick Recap
Product prices and availability are accurate as of the date/time indicated and are subject to change. Any price and availability information displayed on Amazon at the time of purchase will apply.

