Some links on this page are affiliate links: if you buy through them we may earn a commission, at no extra cost to you.
The reliable way to save a page’s network traffic with Python is to capture it at a proxy boundary. Run mitmproxy or mitmdump, point the browser at 127.0.0.1:8080, install mitmproxy’s local CA so HTTPS can be decrypted, then write the flows to a native flow file and/or HAR. For a one-off browser investigation, Chrome DevTools can export the Network panel directly as HAR.
“All traffic” has a precise limit: you save what the instrumented browser or device sends through the capture point, during the capture window, using protocols the proxy can observe and decrypt. Requests made before instrumentation, traffic that bypasses the proxy, unsupported protocols and TLS sessions the client will not trust will be absent.
Pick the capture point before writing Python
There are three practical architectures. Use DevTools when you need one tab and the least setup. Use the Chrome DevTools extension API when a browser extension should receive requests as they finish. Use mitmproxy when Python must control capture, when more than one client is involved, or when you need replayable files and HTTP-level scripting.
| Approach | What it sees | Automation | Export | Main trade-off |
|---|---|---|---|---|
| Chrome DevTools Network panel | Requests known to that DevTools session and tab | Manual | HAR | Fastest setup, but only for the browser session you open |
chrome.devtools.network |
The extension’s inspected tab | JavaScript extension API | HAR objects and request events | Content is fetched separately and the API is not a Python API |
| mitmproxy or mitmdump | Any correctly configured client routed through the proxy | CLI plus Python addons | Native flow files and HAR | Requires proxy configuration and a trusted CA for HTTPS inspection |
Method 1: export a complete browser session from Chrome
This is the shortest route when you are investigating one page manually.
#1 Best Overall

- Multifunctional NOYAFA NF-8508 Network Cable Tester: There are nine features to meet your needs. Continuity Testing, Cable Scan, Port Flash, Length Measurement, POE Power Supply Test, QC testing, Optical Power Meter, VFL and NVC function.It is perfectly suited for various engineering cabling projects, network troubleshooting, network equipment maintenance and testing scenarios. Its precise cable scanning and fault localization capabilities help you effortlessly pinpoint the root cause of issues.
- 7 WAVELENGTHS OPTICAL POWER METER: NF-8508 network cable tester can measure 7 standard wavelengths, 850/1300/1310/1490/1550/1625/1650, power detecting range(dBm): -70 ~ +10. Its power detection range spans from -70 dBm to +10 dBm, supporting FC/SC/ST connectors. It enables precise fiber optic power measurement, helping users efficiently assess fiber signal strength and ensure healthy fiber link operation. It effortlessly detects attenuation issues within fibers, thereby safeguarding fiber network stability.
- High Efficiency Visual Fault Locator: Easy identification of fiber breakpoints, poor connections, bending or cracking. Excellent for finding the right fiber to splice or quickly finding a break. Emmiting Energy: standard wavelenth: 650nm. Fast flashing, slow flashing, high precison.The built-in self-calibration ensures stable long-term performance, and Class IIIa laser (output<5mW) ensures safe daily operation.
- PORT FLASHING:The indicator light on the connection port in the NF-8508 device flashes to help accurately locate the cable. Displays port information, including operating speed, duplex mode, and negotiation settings. Port lights flash on the same screen to show the port's operating speed, making it easy to pinpoint lines and ports.
- PoE Testing and Cable Length Test: PoE testing can check cable mapping polarity and voltage of PoE network switches, withstand 60VDC. Automatically detects and switches between 10M/100M/1000M modes, Includes cable tracking, short circuit test, interruption of circuit test and etc The RJ45 cable tester can quickly measure the length of the cable with a range of 200m. Not only network cables, but also phone lines and BNC cables.
- Open Chrome DevTools with Ctrl+Shift+I (Windows/Linux) or Command+Option+I (macOS).
- Select the Network panel before navigating to the target URL.
- Turn on Preserve log if you need requests to survive a navigation. Enable Disable cache only when you intentionally want uncached behavior.
- Reload the page while DevTools is already open. Opening DevTools after the page has loaded can miss early requests.
- Exercise the page: click controls, submit forms and scroll far enough to trigger lazy resources. The Network panel only records activity that occurs while it is attached.
- Right-click the request list and choose the HAR export command. Chrome offers a sanitized HAR and a HAR that includes sensitive data, depending on the DevTools preference you select.
The sanitized export deliberately excludes sensitive headers such as Cookie, Set-Cookie and Authorization. Choose the sensitive-data option only when the investigation genuinely requires those values, and store the file as confidential. A HAR can contain account identifiers, query parameters, response content and bearer credentials.
Chrome can import the resulting HAR back into DevTools for inspection. Treat it as evidence of the requests known to that tab, not as a machine-wide packet trace.
Method 2: collect requests through the Chrome DevTools API
A Chrome extension that declares DevTools access can call chrome.devtools.network.getHAR() to obtain the known HAR log and subscribe to chrome.devtools.network.onRequestFinished for requests as they complete. This is useful when a browser workflow must trigger capture automatically.
The Tool Desk
Outbyte Driver Updater FREEFix the driver behind crashes, sound loss and screen glitchesFind Drivers →Outbyte PC Repair FREERepair Windows errors before they cause bigger problemsFix Now →Minimal extension-side collector
The following JavaScript belongs in a DevTools page or panel of an extension with the appropriate DevTools permission. It writes request metadata to the extension console and fetches response content only when needed:
chrome.devtools.network.onRequestFinished.addListener(async (request) => {
  const entry = request;
  console.log({
    url: entry.request.url,
    method: entry.request.method,
    status: entry.response.status,
    mimeType: entry.response.content.mimeType
  });

  // Content is not included by default; request it explicitly when required.
  entry.getContent((body, encoding) => {
    console.log({ url: entry.request.url, encoding, body });
  });
});

function exportKnownHar() {
  chrome.devtools.network.getHAR((har) => {
    const blob = new Blob([JSON.stringify(har, null, 2)], {
      type: 'application/json'
    });
    const link = document.createElement('a');
    link.href = URL.createObjectURL(blob);
    link.download = 'network.har';
    link.click();
    URL.revokeObjectURL(link.href);
  });
}
getHAR() returns what the DevTools session knows at that moment. The event listener is better for long-running workflows; call getContent() selectively because downloading every response body increases memory use and can expose secrets. This API does not retroactively recover requests that happened before the extension or DevTools session was active.
Rank #2
![[Upgraded] AURSINC NanoVNA-H Vector Network Analyzer 9KHz -1.5GHz Latest HW V3.7 HF VHF UHF Antenna Analyzer, Measuring S Parameters, SWR, Phase, Delay, Smith Chart](https://m.media-amazon.com/images/I/41hseV6xSbL._SL160_.jpg)
- [UPGRADED NanoVNA-H] New HW Version V3.7. It is upgradeable as new firmware is developed. With MicroSD card port now can have the measurement data or the screenshots saved in the it at anytime. Added battery circuit management, more secure. Redesigned PCB, you can connect to mobile phone with Type C-Type C cable (original PCB needs OTG cable), see a clear HD image on your phone. Added a ABS case, which is protective and dust-proof. Disply: 2.8 inch TFT (320 x240).
- [IMPROVED FREQUENCY ALGORITHM] The improved frequency algorithm can use the odd harmonic extension of si5351 to support the measurement frequency up to 1.5GHz. The 9KHz-300MHz frequency range of the si5351 direct output provides better than 70dB dynamic, The extended 300M-900MHz band provides better than 60dB of dynamics, and the 900M-1.5GHz band is better than 40dB of dynamics.
- [MULTIPLE FUNCTIONS] The default firmware main function is used for antenna performance measurement. The TX/RX method can measure the complete S11 and S21 parameters. If you need to obtain S12 and S22, you need to manually replace the transceiver port wiring. The CH0 output level is increased to 0dBm when using the fundamental wave, resulting in more accurate reflection measurement.
- [SUPPORT ANDROID PHONE & PC SOFTSARE CONTROL] Designed a practical and simple control application on PC, you can download touchstone(SNP) files for radio design and simulation software. There is a PC interface that adds functionality and lets you work interactively on a bigger screen. Supports time domain analysis function (TDR). Compatible with most Android mobile phones, convenient for connecting to mobile phones. Support Windows Computer Control.
- [STRONG AND SECURE POWER SUPPLY] This VNA is battery powered or USB powered. Built in 650mAh battery, could work for 2 hours continuously. For longer measurement time, kindly connect an external power source. The product interface displays battery usage, providing a clear understanding of the power status.
Method 3: capture browser traffic with mitmproxy and Python
mitmproxy is an SSL/TLS-capable intercepting proxy for HTTP/1, HTTP/2 and WebSockets. It can save complete HTTP conversations for replay and analysis, and its Python addon API can inspect or modify flows. The regular proxy mode is the simplest choice when the client lets you enter an HTTP proxy address.
1. Start mitmdump and choose output files
Run this command from a terminal:
mitmdump
  --listen-host 127.0.0.1
  --listen-port 8080
  --set hardump=traffic.har
  -w traffic.flow
traffic.flow is mitmproxy’s native flow file. The hardump setting writes a HAR containing captured flows when mitmdump exits. Stop the process with Ctrl+C after the browsing session so the HAR is finalized. The same capture can be viewed interactively with mitmproxy or mitmweb instead of mitmdump.
Free tools Windows power users keep installed
One-click scans. No signup required.
2. Route the browser through the proxy
- Set the browser’s HTTP and HTTPS proxy to
localhost(or127.0.0.1) on port8080. Configure both schemes if the browser has separate fields. - With the proxy running, visit
http://mitm.itin that browser. - Download and install the mitmproxy certificate authority for the operating system or browser. HTTPS contents cannot be inspected until the client trusts this CA.
- Open the target site in a new tab, perform the workflow, then stop mitmdump.
Installing a proxy CA changes the trust boundary: mitmproxy can generate certificates for intercepted sites, and the resulting HAR or flow files may contain passwords, session cookies, personal data and private API responses. Remove the CA or disable the proxy when you finish, and keep capture files out of shared logs.
3. Add a Python addon for structured logging
Native flow and HAR output are usually the best complete records. Add a Python addon when you also need a compact, machine-readable index of requests and responses:
# index_addon.py
import json
from datetime import datetime, timezone
from mitmproxy import http

OUT = "traffic-index.jsonl"

def _write(record):
    with open(OUT, "a", encoding="utf-8") as f:
        f.write(json.dumps(record, ensure_ascii=False) + "n")

def response(flow: http.HTTPFlow):
    req = flow.request
    res = flow.response
    _write({
        "captured_at": datetime.now(timezone.utc).isoformat(),
        "method": req.method,
        "url": req.pretty_url,
        "request_headers": dict(req.headers),
        "status": res.status_code if res else None,
        "response_headers": dict(res.headers) if res else {},
        "request_body_bytes": len(req.raw_content or b""),
        "response_body_bytes": len(res.raw_content or b"") if res else 0,
    })
Start the proxy with the addon:
mitmdump -s index_addon.py
  --listen-host 127.0.0.1
  --listen-port 8080
  --set hardump=traffic.har
  -w traffic.flow
The JSONL index records headers, URLs and sizes without duplicating bodies. Do not log headers in a shared environment unless you have removed credentials; even a header-only index can include authorization tokens and cookies. Keep the native flow or HAR when exact bodies are required.
Rank #3
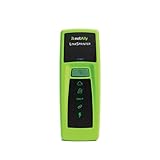
- Rapid Network Testing: One-button, 10-second pass/fail test verifies PoE, Link, DHCP, Gateway, and Internet connectivity
- Network Discovery: Shows nearest switch name/port and VLAN via CDP/LLDP/EDP protocols for comprehensive network mapping
- Wireless Connectivity and Cloud Integration: Built-in Wi-Fi hotspot for mobile UI; automatically uploads results to Link-Live cloud portal
- Portable Design: Pocket-sized, PoE or AA battery powered, designed for frontline and helpdesk teams as a pre-check tool before escalating to advanced testers
- Visual Feedback System: Lighted Indicator Icons provide instant status updates (Does not have a display or touch screen)
4. Read the saved HAR with Python
HAR is JSON, so standard-library Python is enough to summarize status codes and URLs:
Outdated Drivers Are Slowing You Down
One free scan finds every outdated or missing driver and matches the right update for your exact hardware.Free scan · exact hardware matchWindows Errors? Fix Them Before They Spread
Repair common Windows errors and clear accumulated junk for a smoother, more stable PC - no reinstall needed.Free scan · no reinstallimport json
from collections import Counter
with open("traffic.har", encoding="utf-8") as f:
har = json.load(f)
entries = har.get("log", {}).get("entries", [])
statuses = Counter(
entry.get("response", {}).get("status") for entry in entries
)
print(f"captured requests: {len(entries)}")
for status, count in sorted(statuses.items(), key=lambda item: str(item[0])):
print(status, count)
for entry in entries:
request = entry.get("request", {})
response = entry.get("response", {})
print(request.get("method"), response.get("status"), request.get("url"))This parser reports what was written to the HAR; it does not make a second network request or recover content that the proxy could not decrypt.
What “all website traffic” includes—and what it cannot
Traffic you will capture
- Requests generated after the browser or device is routed through the proxy.
- HTTP/1 and HTTP/2 exchanges, plus WebSockets, when the client uses the proxy and mitmproxy can negotiate the connection.
- HTTP/3 where the documented mitmproxy configuration supports it and the client does not bypass the proxy.
- Redirects, API calls, images, scripts, stylesheets and other browser-visible resources that occur during the session.
Traffic that can be missing
- Requests made before DevTools or the proxy was active.
- Connections from another application, tab, device or browser profile that was not configured to use the proxy.
- Traffic that deliberately bypasses the proxy, uses a protocol outside the proxy’s supported interception path, or is protected by certificate pinning or another trust mechanism that rejects the mitmproxy CA.
- HTTPS contents when the CA was not installed, was installed in the wrong browser profile, or the client refuses interception.
For a genuinely broad capture, configure every relevant client, start capture first, verify the proxy is receiving flows, and only then begin the workflow. A browser HAR and a proxy capture answer different questions: the former reflects DevTools’ view of one tab, while the latter reflects clients that actually route through it.
Reliability, performance and data-handling decisions
- Start early: launch mitmdump or open DevTools before navigation so initial redirects, configuration calls and early scripts are present.
- Separate metadata from bodies: use the JSONL addon for indexing and retain full bodies only when debugging requires them. Large downloads can make HAR files expensive to open and store.
- Preserve timing: do not add artificial waits unless the page requires them. A proxy capture changes latency slightly; compare runs under the same proxy conditions.
- Use deterministic sessions: record the browser profile, proxy address, CA version and workflow timestamps alongside the file. This makes a later replay or comparison interpretable.
- Protect secrets: sanitized HAR export is safer when cookies and authorization headers are unnecessary. Encrypt or access-control sensitive HAR and flow files, then delete them according to your retention policy.
- Stop cleanly: let mitmdump exit normally so the configured HAR is flushed. If the process is killed, the final export may be incomplete.
Or skip the browser setup
If your actual goal is a clean visual snapshot rather than a record of every HTTP exchange, ScreenshotNeo returns a PNG, JPEG, WebP or PDF from one request. It is not a network-traffic recorder, so use mitmproxy for HARs and HTTP debugging. Use ScreenshotNeo when you need the rendered result without maintaining a browser, proxy or CA.
Its API accepts the URL and removes cookie-consent banners, newsletter popups and chat widgets before capture. Bot checks or CAPTCHAs, blank pages, timeouts, failed loads and cache hits are not billed, and each response identifies the page verdict and billing result in headers. ScreenshotNeo also provides an MCP server for AI agents, with take_screenshot, get_page_info and capture_pdf tools.
Do these 3 things before closing this tab:
1Fix the driver behind crashes, sound loss and screen glitches2Repair Windows errors before they cause bigger problems3Scan for outdated or missing drivers - takes under a minuteSee the ScreenshotNeo API documentation for all options. A basic call is:
Rank #4
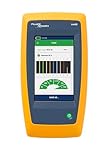
- Cable Performance testing up to 10GBASE-T via frequency-based measurements
- Network features including: IPv4 and v6 ping, nearest switch diagnostics (IP address, name, port / VLAN number, and advertised data rates)
- Ethernet Alliance certified PoE Verification – Detects the PoE class (1-8) and power, and performs a load test of available PoE from the connected switch
- Displays cable length, wire map, and distance to open or short
- Manage results and print reports from LinkWare PC
curl -G "https://api.screenshotneo.com/v1/shot" -d access_key=YOUR_API_KEY --data-urlencode url=https://stripe.com -o shot.webpThe same request in Python:
import requests

r = requests.get(
    "https://api.screenshotneo.com/v1/shot",
    params={"access_key": "YOUR_API_KEY", "url": "https://stripe.com"},
    timeout=90,
)
r.raise_for_status()
open("shot.webp", "wb").write(r.content)
And in Node.js:
const q = new URLSearchParams({ access_key: 'YOUR_API_KEY', url: 'https://stripe.com' });
const res = await fetch(`https://api.screenshotneo.com/v1/shot?${q}`);
if (!res.ok) throw new Error(`Screenshot failed: ${res.status}`);
const fs = await import('node:fs/promises');
await fs.writeFile('shot.webp', Buffer.from(await res.arrayBuffer()));
The Free plan includes 1,000 screenshots per month with no card. Paid plans start at $5 for 3,000 shots, and every feature is available on every plan. Create a free ScreenshotNeo account to try the visual-capture workflow.
Troubleshooting common capture failures
The HAR is missing the first requests
DevTools was opened after navigation, or the proxy started too late. Open DevTools before reloading, or start mitmdump and verify the proxy before opening the page.
The browser shows certificate warnings or HTTPS is unreadable
The browser is not trusting the mitmproxy CA, the certificate was installed in another profile, or certificate pinning rejects interception. Revisit http://mitm.it through the configured proxy, install the certificate for the exact browser profile, and test on a site you control before handling production credentials.
No flows appear in mitmdump
The browser is not using localhost:8080, only one proxy scheme was configured, or another system proxy overrides it. Confirm the address and port, reload the page, and watch the mitmdump console for a new connection.
Some resources are absent even though the page looks complete
The resources may have loaded before capture, come from a client that bypasses the proxy, or use a protocol or trust model the proxy cannot inspect. Repeat with capture active from the first navigation and check whether the missing request belongs to another application or browser profile.
Best Value

- VERSATILE CABLE TESTING: Cable tester tests voice (RJ11/12), data (RJ45), and video (coax F-connector) terminated cables, providing clear results for comprehensive testing on unenergized Ethernet cables (not designed to test PoE)
- EXTENDED CABLE LENGTH MEASUREMENT: Measure cable length up to 2000 feet (610 m), allowing for precise cable length determination
- COMPREHENSIVE FAULT DETECTION: Test for Open, Short, Miswire, or Split-Pair faults, ensuring thorough fault detection and identification
- BACKLIT LCD DISPLAY: Backlit LCD screen displays cable length, wiremap, cable ID, and test results, ensuring easy readability in various lighting conditions
- EFFICIENT CABLE TRACING: Trace cables, wire pairs, and individual conductor wires using the multiple style tone generator (requires analog probe Cat. No. VDV500-123, sold separately), simplifying cable tracing tasks
The HAR is empty or incomplete after stopping
Stop mitmdump with Ctrl+C and wait for its normal shutdown. A forced termination can prevent the hardump export from being finalized.
Response bodies are missing from extension output
chrome.devtools.network.getHAR() does not include content by default for efficiency. Call getContent() on the individual request objects you need, and avoid fetching every body in a large session.
Recommended Free Tools
The capture contains secrets
Use Chrome’s sanitized HAR option when sensitive headers are unnecessary, avoid sharing native flow files, rotate credentials exposed during an authorized test, and delete temporary captures after analysis.
Frequently Asked Questions
Can I use the DevTools API directly from a normal Python script?
No. chrome.devtools.network is a Chrome extension API. A Python process can coordinate an external browser workflow, but the request events and getHAR() call run inside the extension’s DevTools context.
Should I save HAR, native flows, or both?
Save both when you need portability and later replay: HAR is convenient JSON for tools and reports, while the native flow file preserves mitmproxy’s richer session representation.
The Bottom Line
Use Chrome’s Network export for a single tab; use mitmproxy or mitmdump plus a trusted CA when Python must capture and save traffic from configured clients. Start instrumentation before navigation, treat captures as sensitive, and remember that no tool can record traffic that never passes through its capture point.
Quick Recap
Product prices and availability are accurate as of the date/time indicated and are subject to change. Any price and availability information displayed on Amazon at the time of purchase will apply.

